2026 Data Viz Submissions
Students
The 2026 student visualization dataset is available for download (CSV).
1st Place: Andre Bianchi and Sophia Perez
College Fight Song Trope Analysis
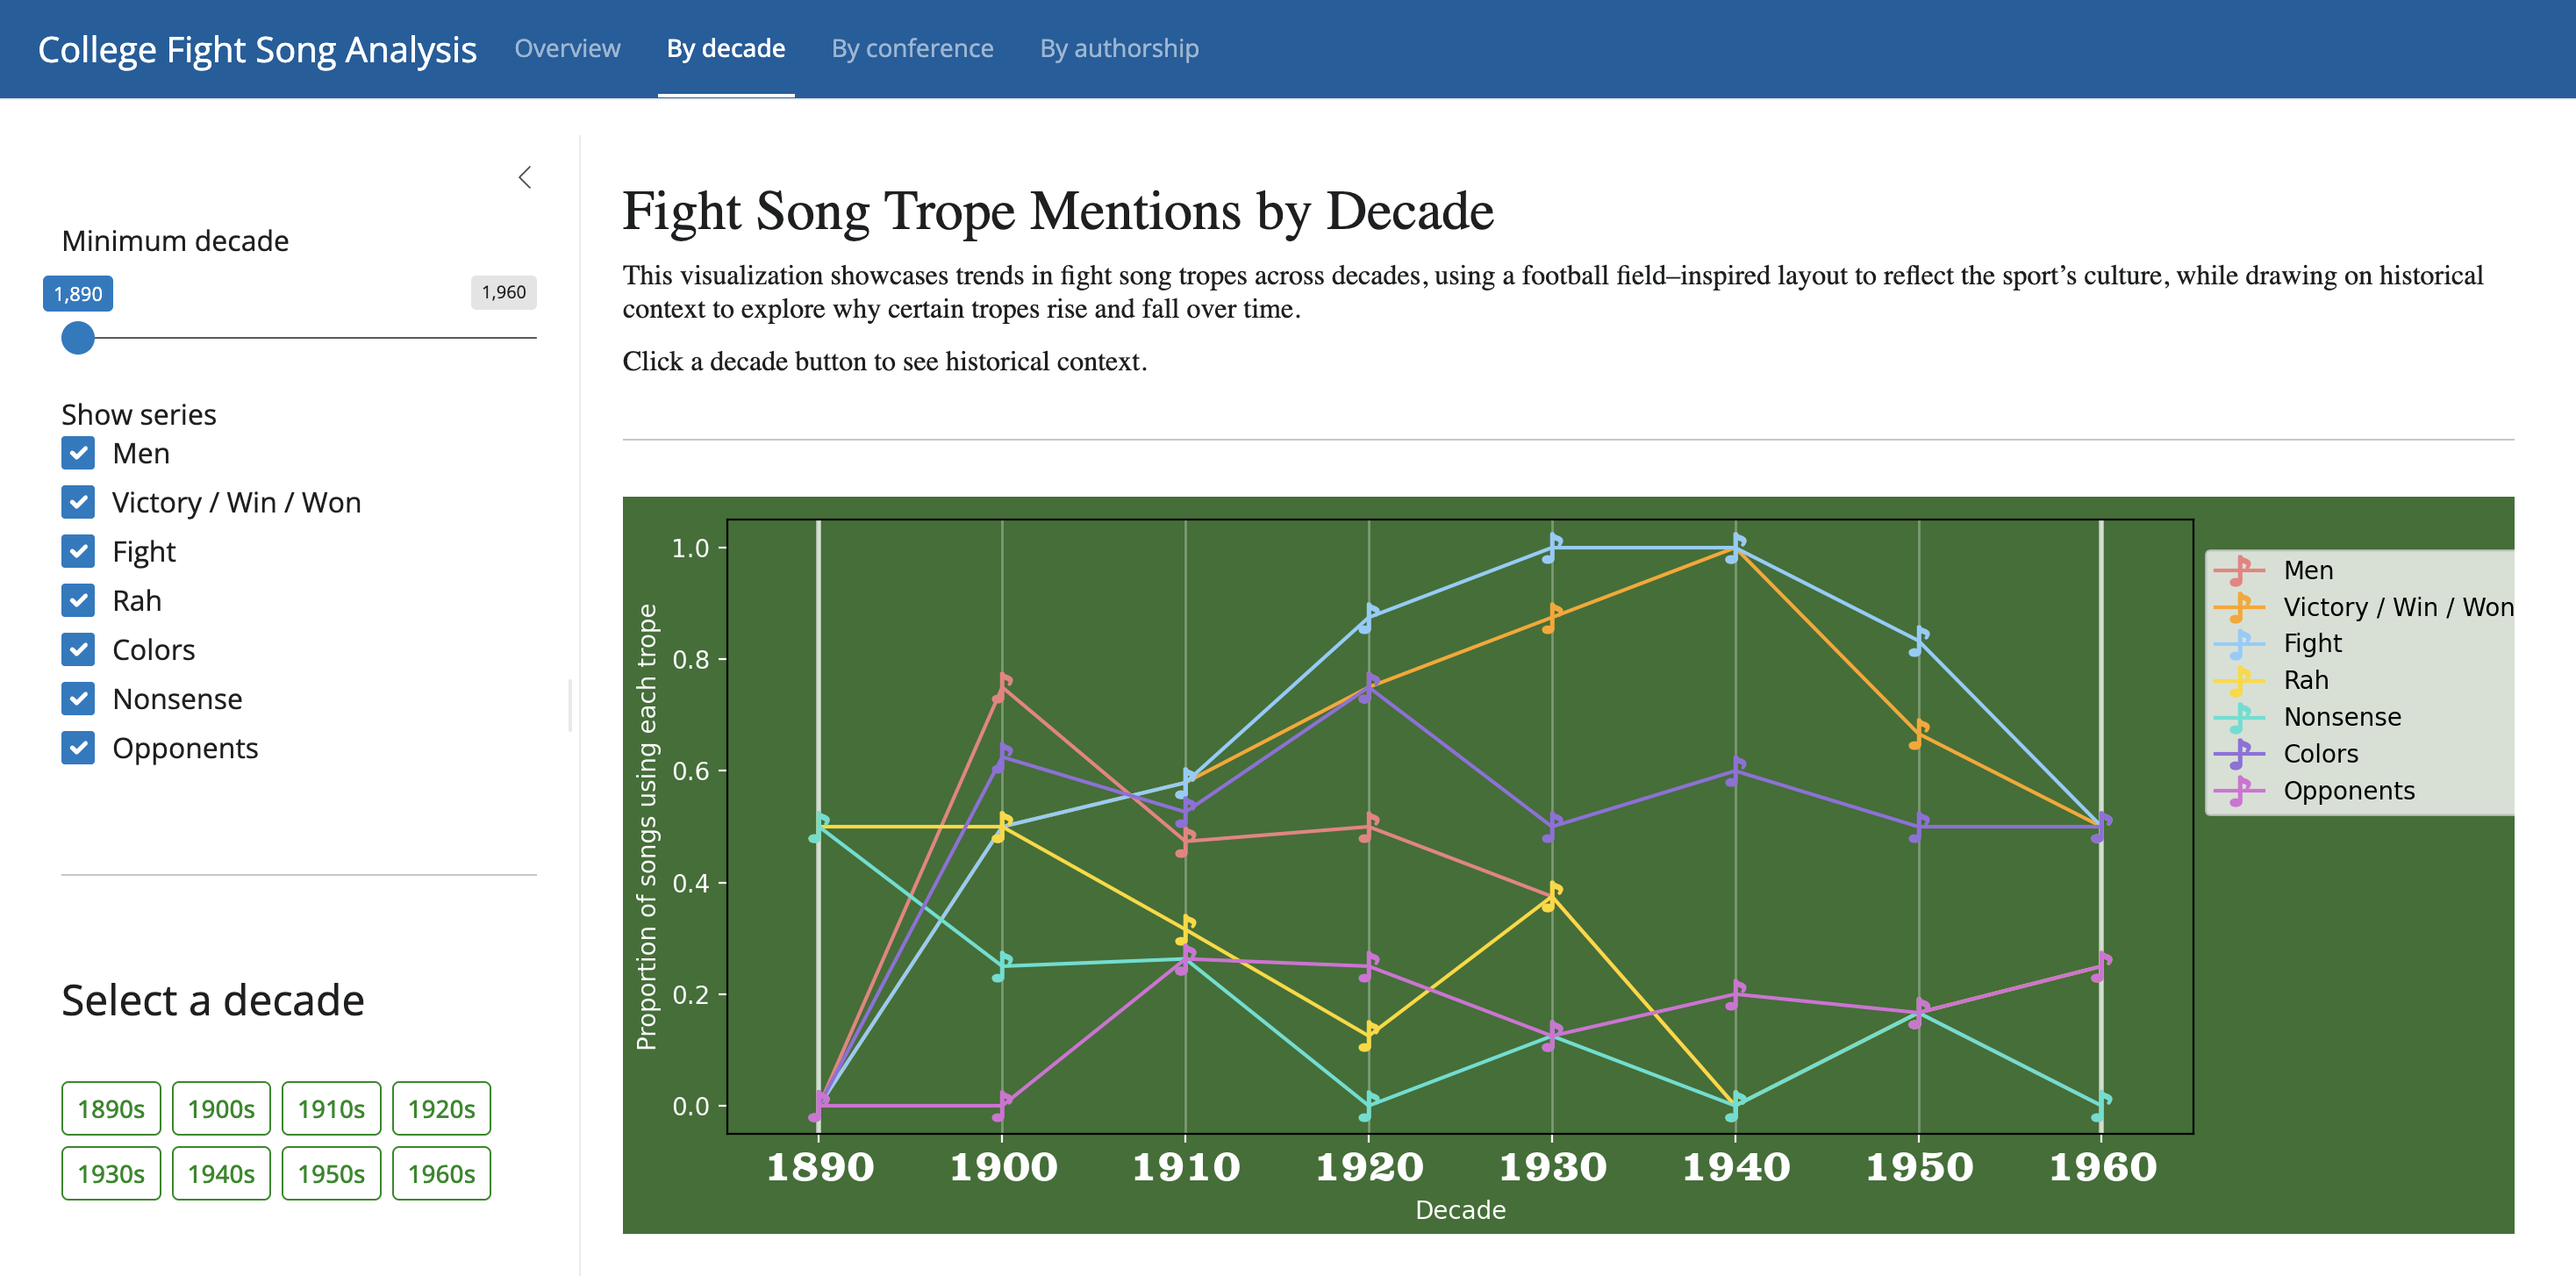
College fight songs are a unique intersection of music, athletics, and institutional identity. This project examines how common lyrical tropes, such as references to victory, opponents, school colors, and collective identity, have evolved across decades, by athletic conference, and by authorship.
2nd Place: Daniel Amusin and Arthi Kozhumam
Fight Songs and Football Fortunes

Do schools with wins, victory, and other win-related tropes win more football games? We attempted to find out. By mapping locations of schools from the Fight Song dataset along their mentions of "victory," "win," "won," or number of all tropes; matching this to a public dataset of college football stats; and creating linear models, we identified no statistically significant association between tropes and either total or percent football wins or bowl game eligibility.
We followed up by identifying whether (a) schools with win-related songs are spatially clustered and whether these correspond to spatial patterns in football success (answer: no), and (b) accounting for spatial dependence changes the association found (no; for a few schools the relationship is significant, but the general trend is not).
Faculty and Staff
1st Place: Augusta Zukauskas
NIH Project Collaborations Among Big Ten Universities in 2024
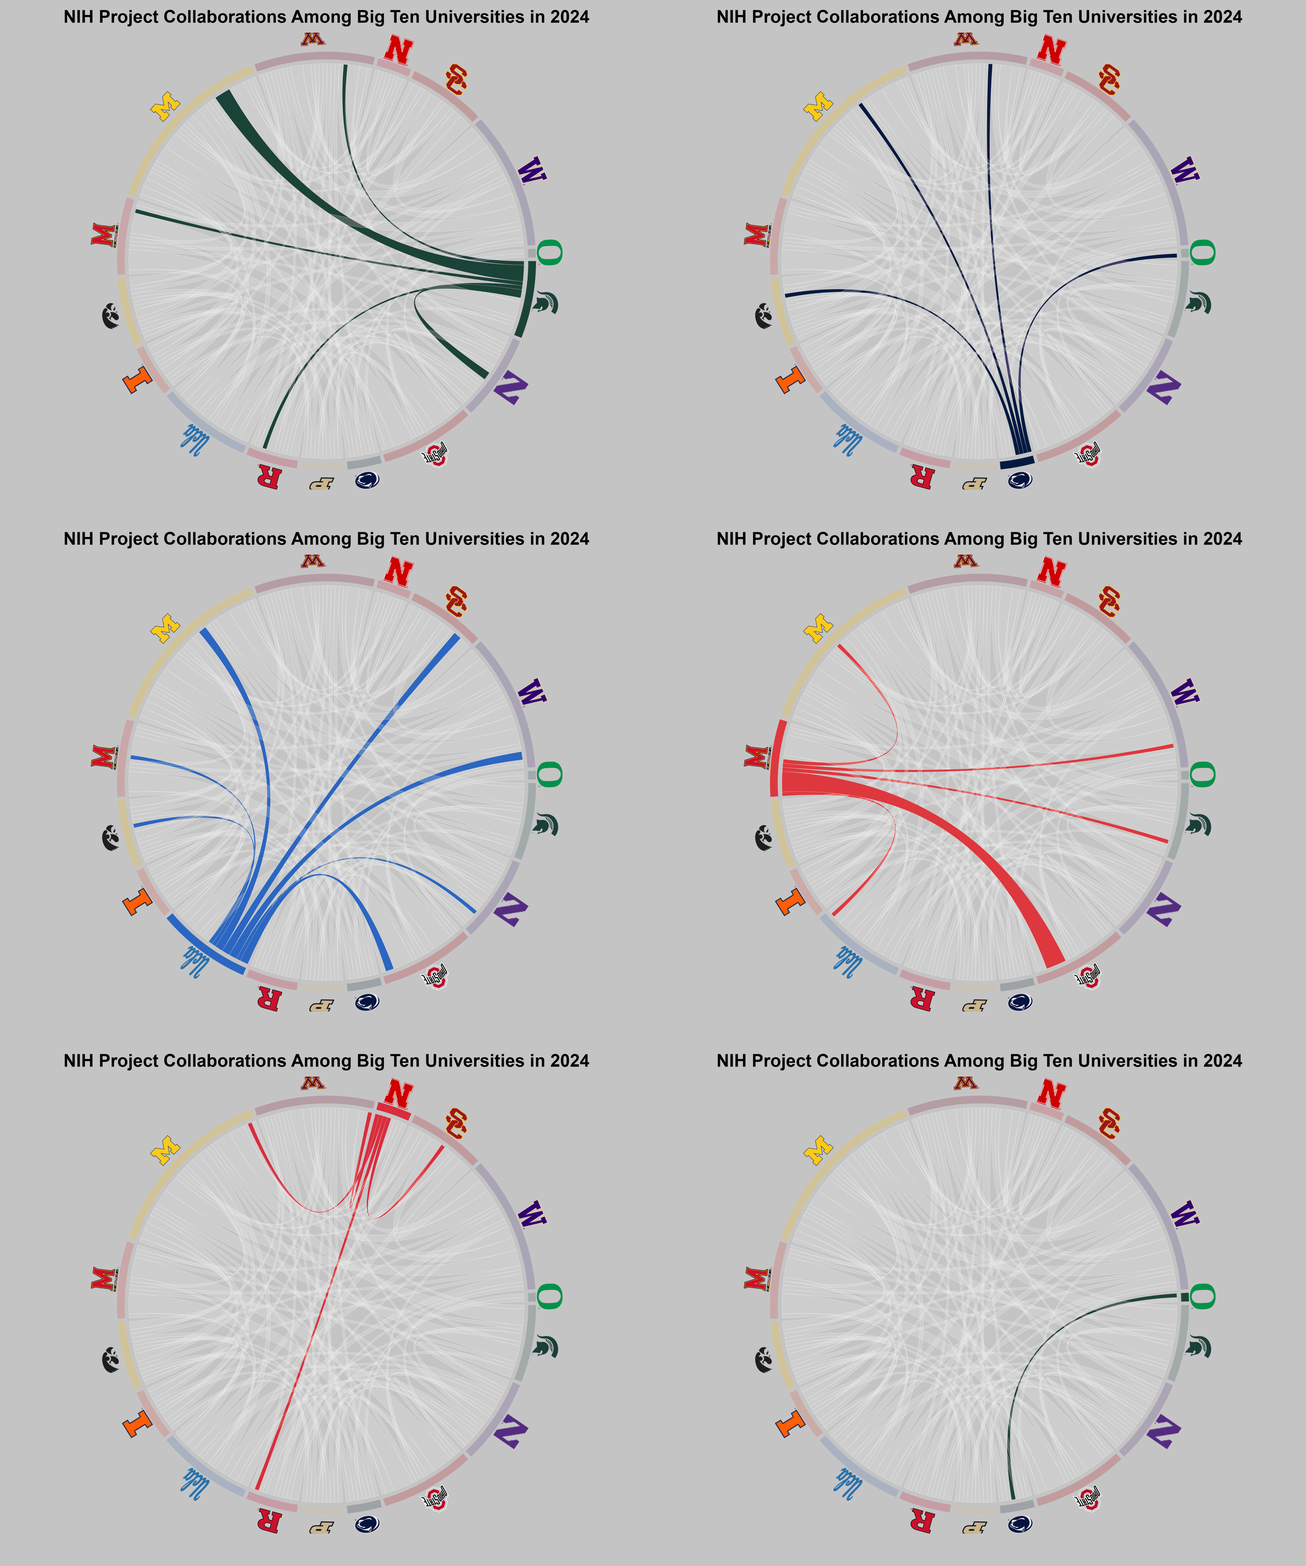
This project analyzes project collaborations funded by the NIH among Big Ten universities. The goal was to provide a clear, compelling overview of collaboration patterns and strengths. Working on an NIH-funded project has shown me the value of collaboration and dedication. This visualization highlights the effort and strong partnerships that drive our research forward.
Data was sourced from NIH RePORTER, cleaned to include only Big Ten institutions, and normalized so variations in university names were grouped under a single standard name. Collaborations were counted when the same Principal Investigator (PI) ID appeared across more than one university, indicating shared involvement in multiple institutions. To highlight each institution's role, I created separate chord diagrams focusing on individual universities and then combined these images into a single animated GIF using Adobe tools.
2nd Place: Paisley Lyn Drzewicki Lucier and Sanchary Pal
The State of Integrated Marketing in 2025 (PDF)The Marketing Technology Paradox: Analysis of 161 marketing professionals reveals a counterintuitive finding: "higher technology usage correlates with MORE concern about IMC (r=0.160, p=0.042) yet FEWER execution challenges (r=-0.179, p=0.023). Companies earning >$1B report 25% higher IMC quality scores."
3rd Place: Ed Hunt and Sanchary Pal
Advertising Ecosystem
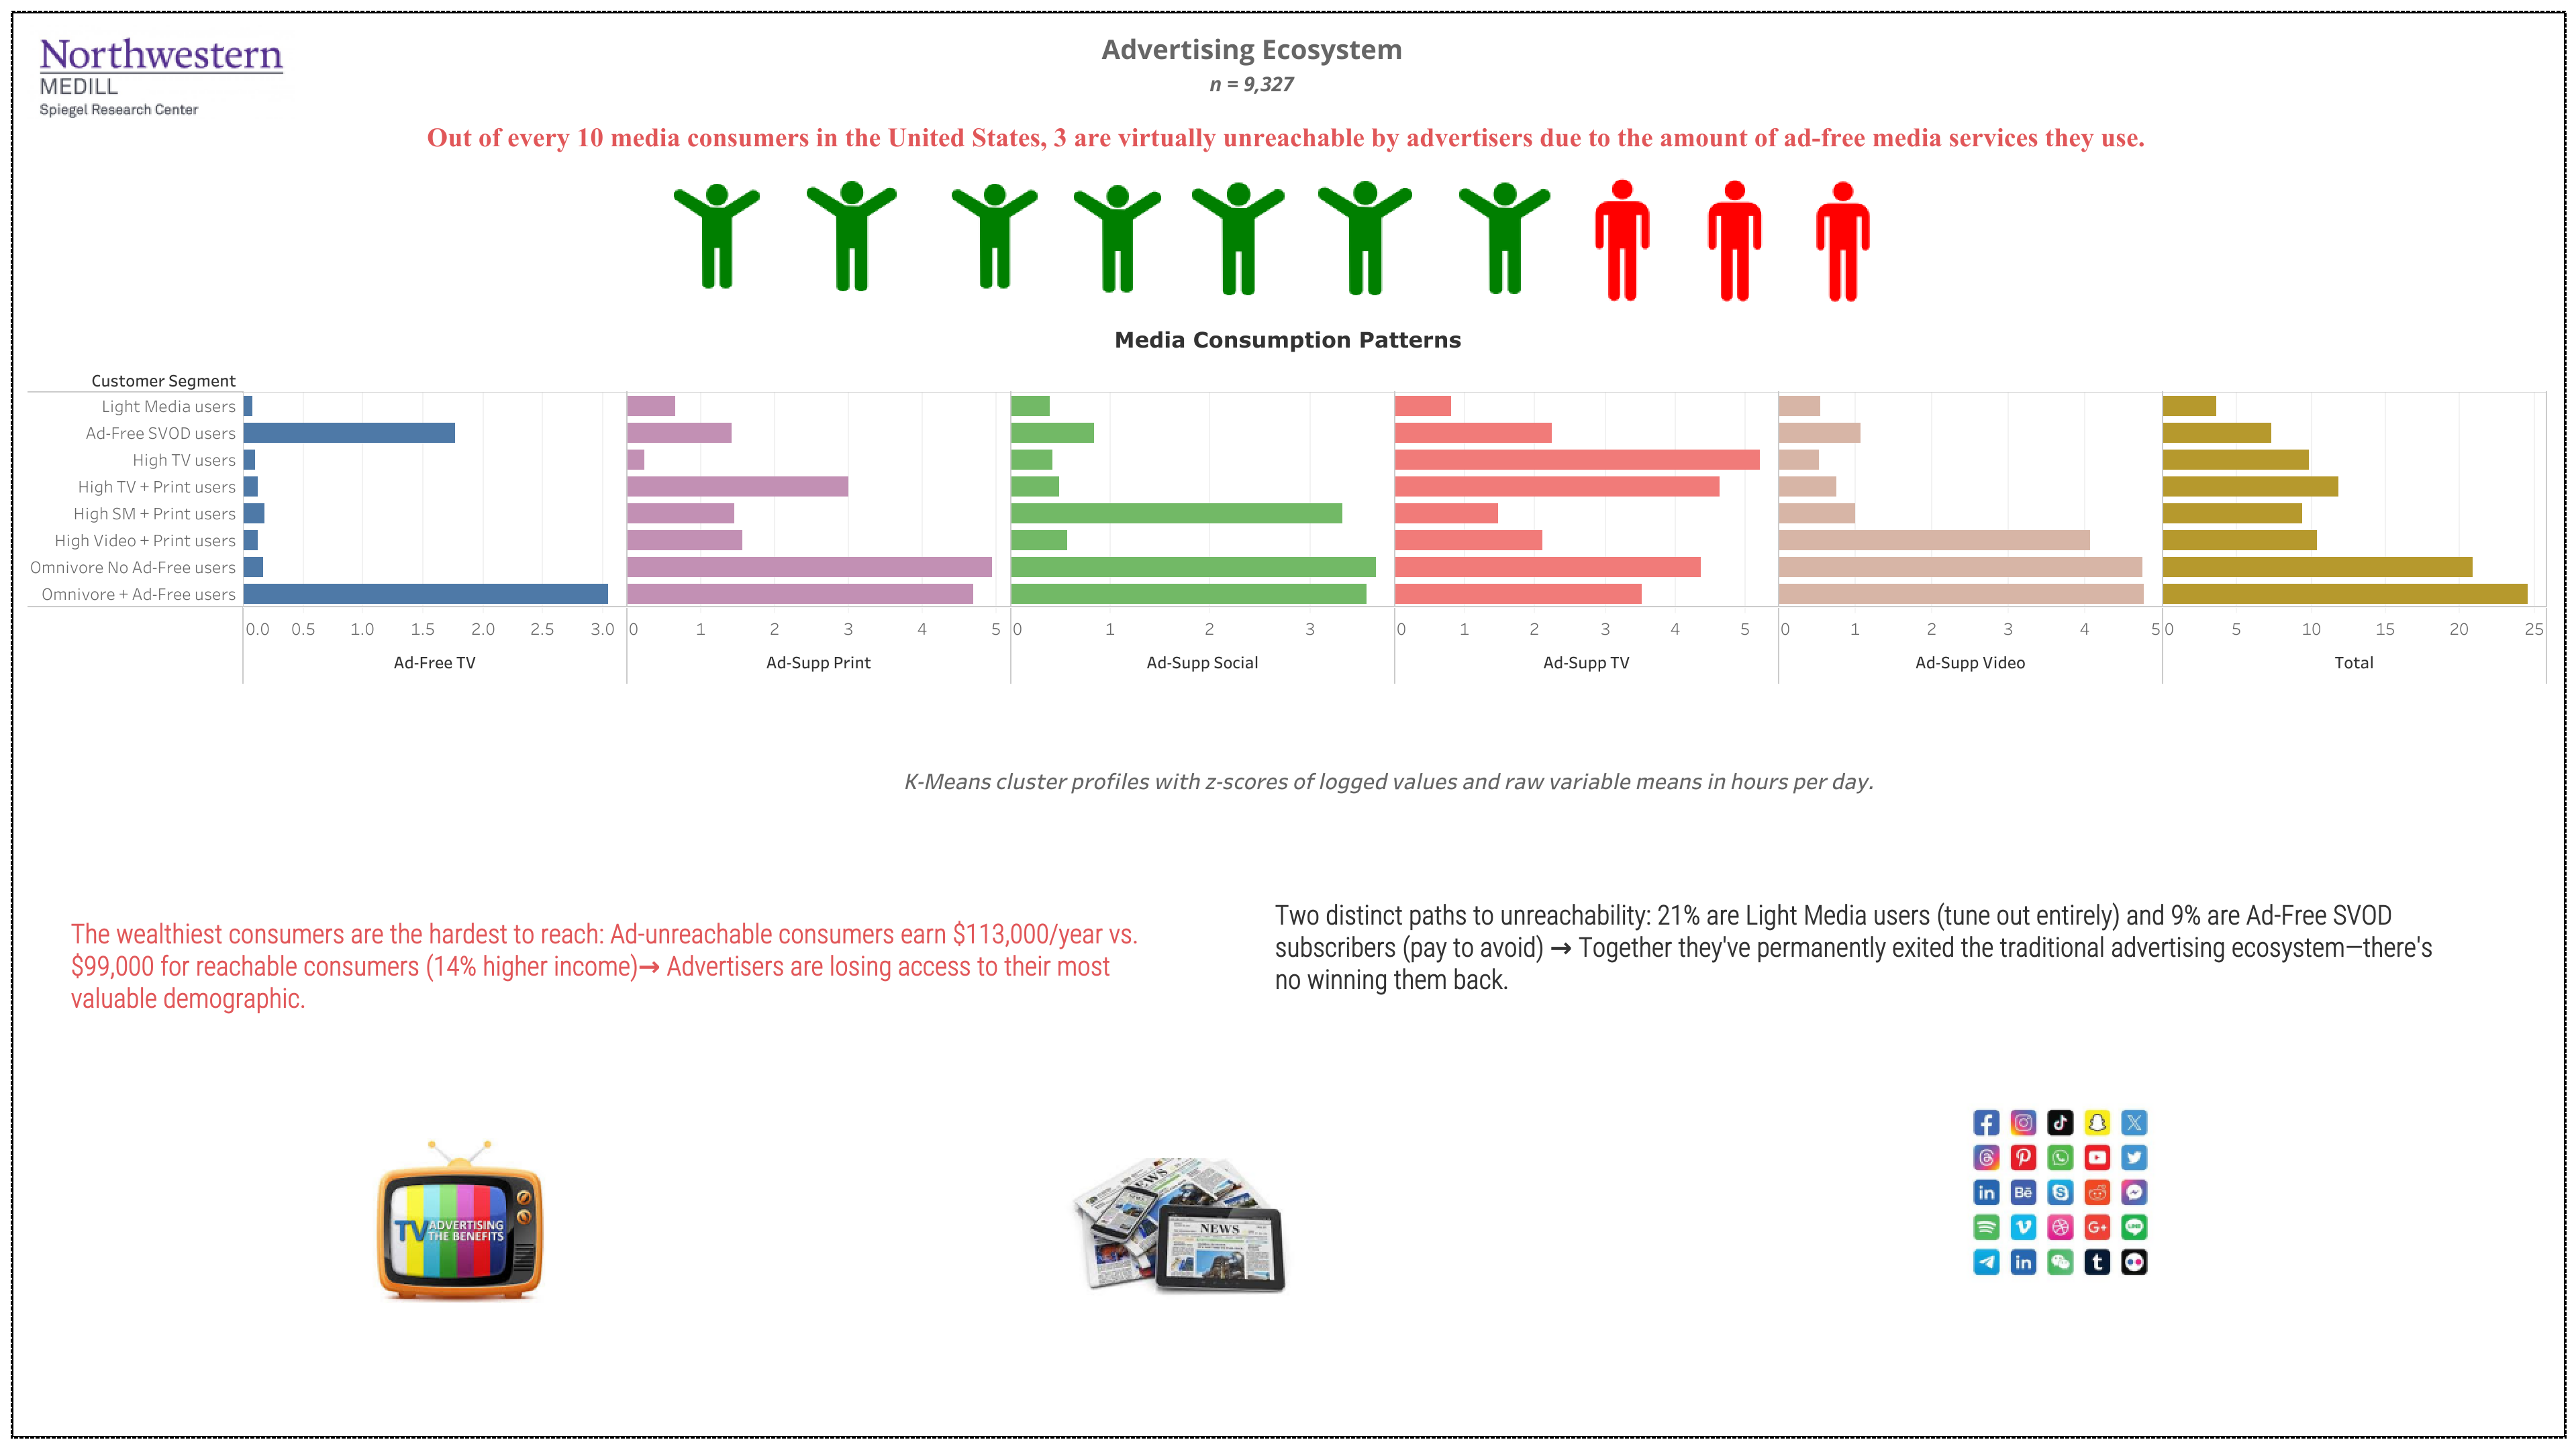
The advertising ecosystem has fractured: 30% of American consumers are unreachable through traditional channels. This visualization maps eight consumer segments, revealing that the wealthiest demographics have permanently opted out: either avoiding media entirely or paying premium subscriptions to escape advertising.