Measuring Northwestern's Greenhouse Gas Emissions
Overview:
Northwestern completed its second annual Greenhouse Gas Emissions Inventory for the 2017 fiscal year. sustainNU will use the results to identify emission reduction opportunities and to measure progress toward the objective of becoming net zero by 2050. The inventory breaks down greenhouse gas emissions into three categories, or scopes, based on the source of emissions.- Scope 1 includes direct emissions from sources that are owned or controlled by Northwestern. For example, this scope includes emissions from the combustion of natural gas used for heating and cooling campus buildings.
- Scope 2 emissions are indirect emissions from sources upstream from the University. This includes emissions associated with the generation of the electricity consumed on campus.
- Scope 3 emissions come from sources that are not owned or directly controlled by Northwestern but are related to Northwestern activities. This includes emissions from commuting, business travel, and waste disposal.
Methodology:
To align with new industry standards and to allow for accurate benchmarking with peer institutions, this year Northwestern used a market-based method for measuring greenhouse gas emissions. The latest emissions inventory used this methodology to calculate emissions from the 2012 baseline through the 2017 fiscal year. Market-based reporting captures the impact of voluntary participation in renewable energy markets, custom fuel mix from energy procurement, and the purchase of renewable energy credits (REC). In 2016, Northwestern used a location-based methodology. The previous method did not account for participation in renewable energy markets or a custom fuel mix. Also, with the location-based methodology, REC purchases were added as an offset after emissions were calculated.
Northwestern calculated the emissions inventory with support from Sightlines, a consulting group that helped with data analysis and reporting using the Sustainability Indicator Management and Analysis Platform (SIMAP). The SIMAP carbon and nitrogen accounting calculator was developed by the University of New Hampshire to help institutions track their emissions and measure progress toward achieving campus sustainability goals.
Results and Analysis:
Emissions from past years were recalculated using the market-based methodology. Dues to this, results for 2012 through 2016 are different from what was reported in the 2016 Greenhouse Gas Emissions Inventory, which used a location-based methodology. Using the new method, the baseline for 2012 is 253,156 metric tons of carbon dioxide equivalent (MTCDE) emissions. The 2017 emissions inventory were 246,533 MTCDE, with 70 percent of the emissions coming from the Evanston Campus and 30 percent from the Chicago Campus. The 2017 emissions inventory equates to a 3 percent reduction from the baseline. Even with a 4 percent growth in square footage and an increase in population over the previous year, Northwestern is demonstrating a decrease in emissions from the 2012 baseline.
The 2017 report found that 41 percent of Northwestern’s emissions come from Scope 1 sources and that 98 percent of the emissions within this category were from natural gas consumption. Scope 2 made up 31 percent of emissions, all of which were from electricity consumption. Scope 3 made up 28 percent of total emissions, with university travel accounting for more than half of the emissions within this category.
Emissions were higher in 2017 than in 2016, and several factors contributed to this increase. The most significant single factor was a reduction in the purchase of RECs, which are used to offset scope 2 emissions. In 2017, Northwestern purchased 34 percent less REC’s than the previous year, due to timing of the contract renewal. This reduced the offsets of our Scope 2 emissions, resulting in an increase of 33 percent. Northwestern is committed to purchasing 500,000 MWh RECs with a five-year-term through 2021.
In addition, Northwestern’s population has steadily grown, and university-related travel has increased. From 2016 to 2017, the emissions from outsourced travel increased by 30 percent, and study abroad miles traveled increased by 22 percent. The increase in travel contributed to the 20 percent increase in Scope 3 emissions since 2016.
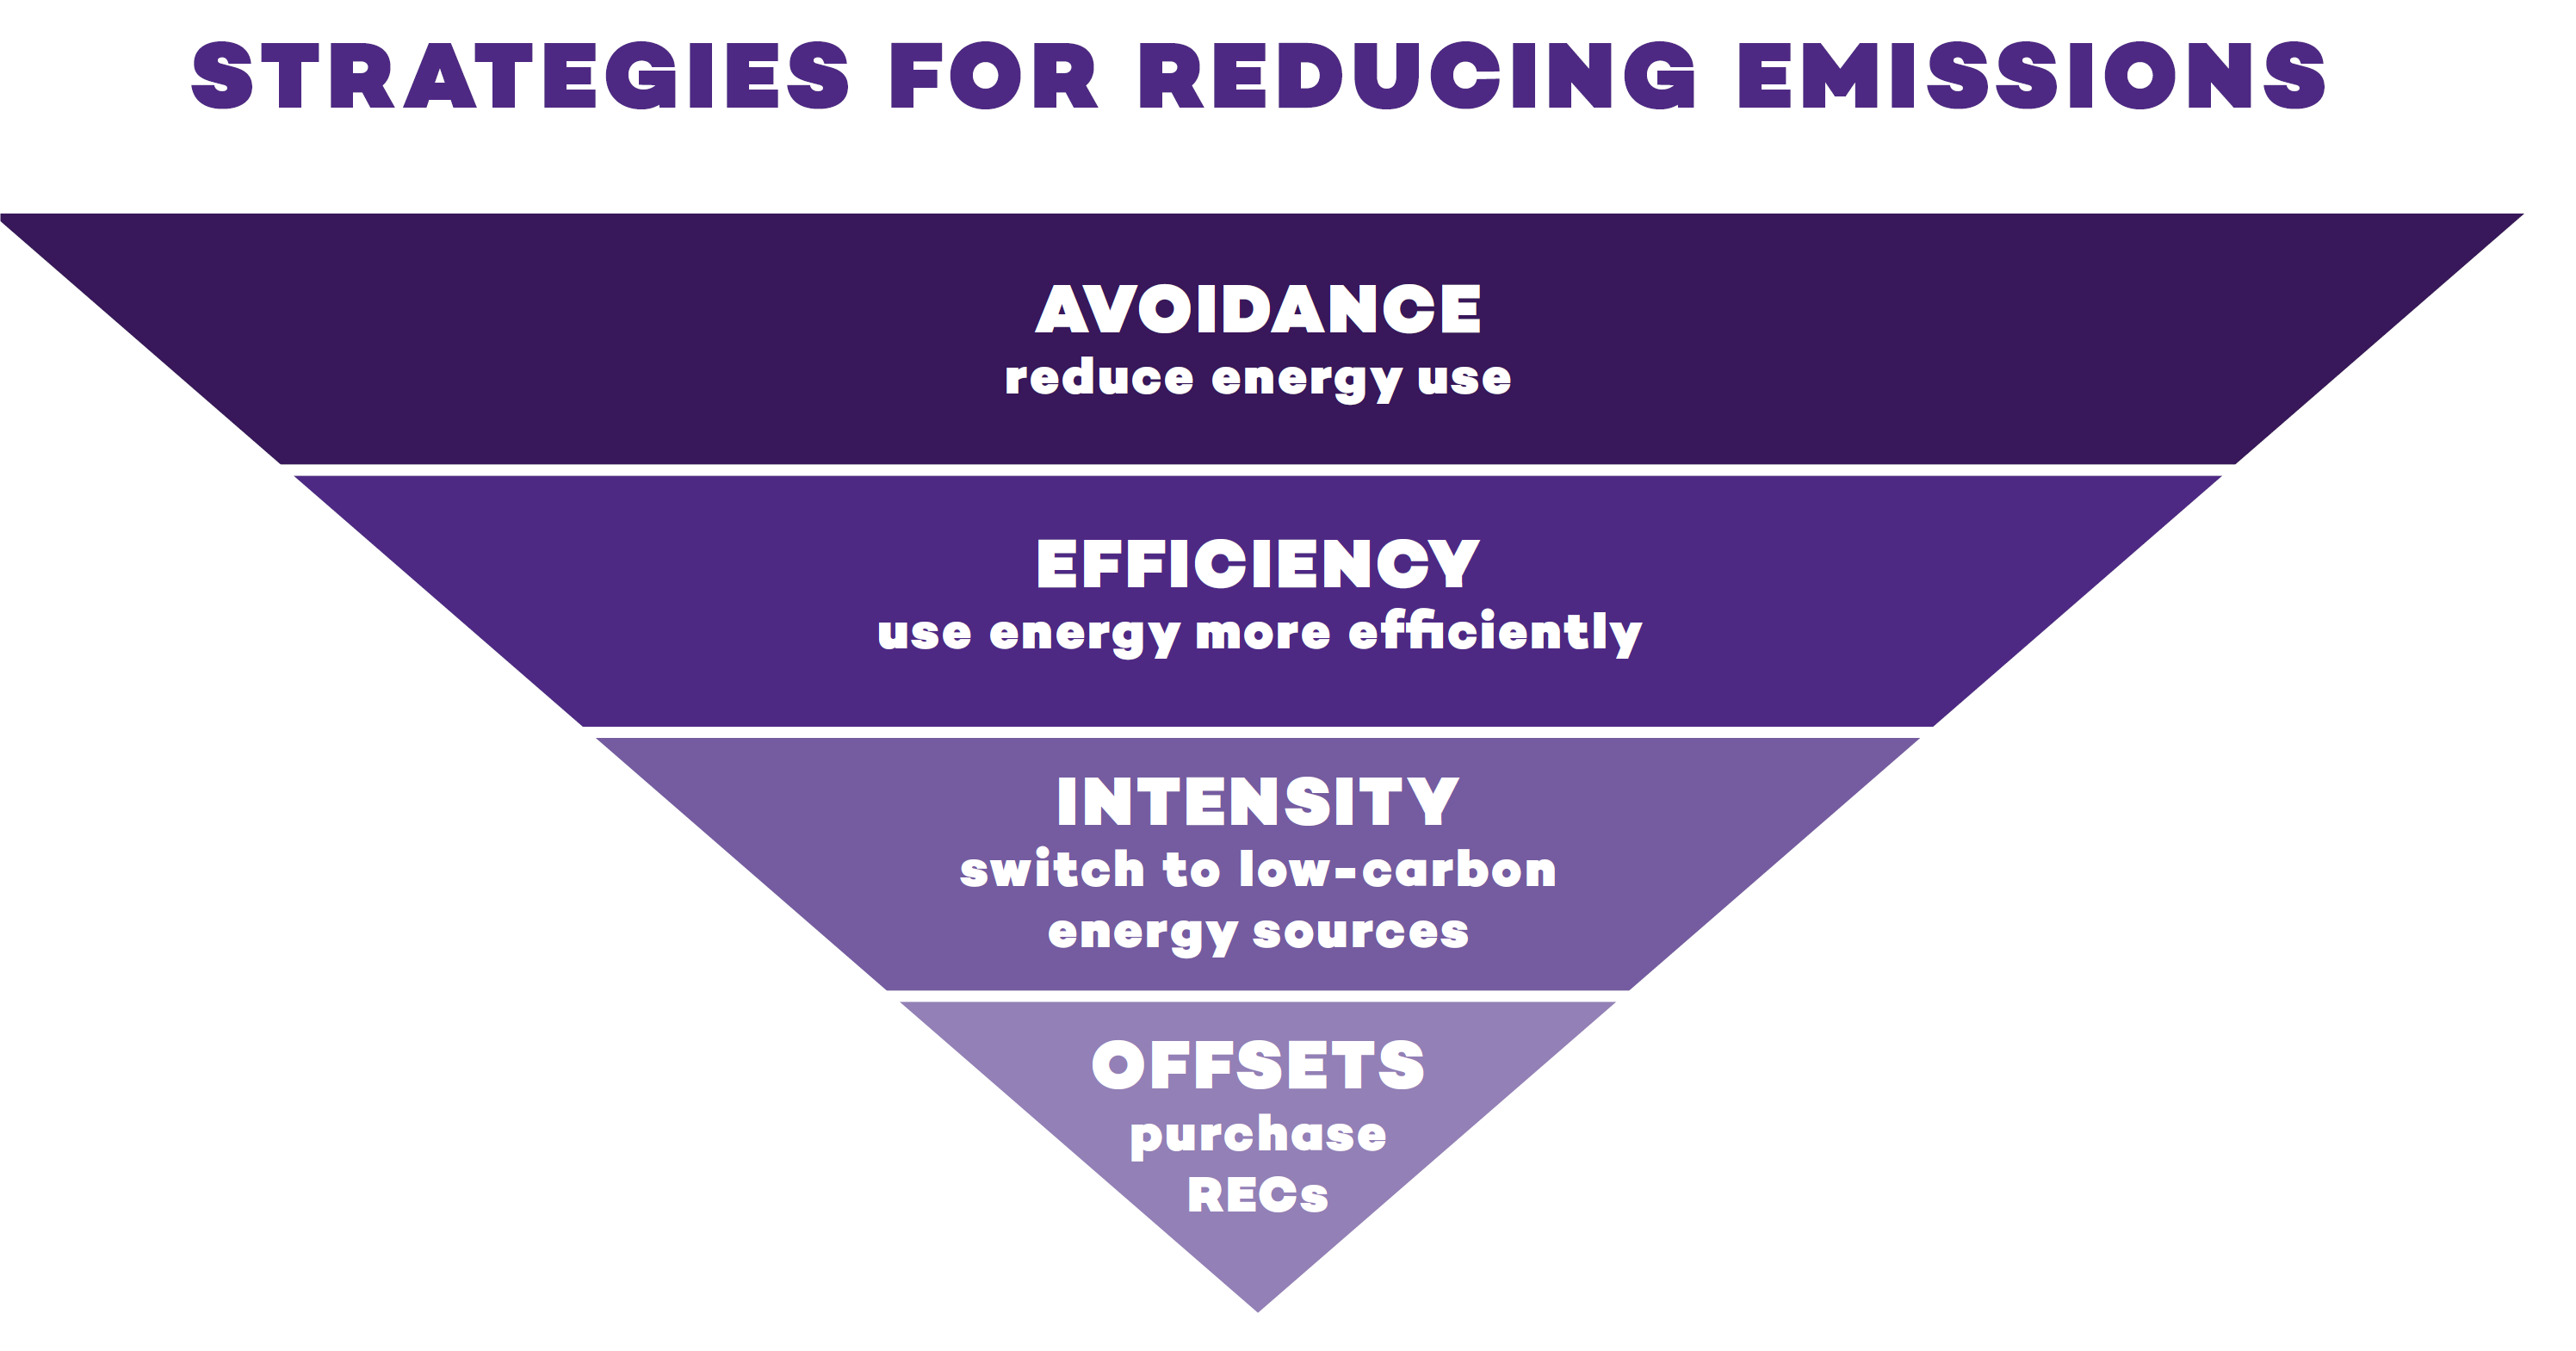
The University will use the results of the 2017 greenhouse gas emissions inventory to develop a strategic approach to reducing campus emissions. By reducing energy use, operating more efficiently, transitioning to cleaner energy sources, and purchasing offsets, Northwestern is on its way to achieving the goal of net zero emissions by 2050. Access the 2017 Greenhouse Gas Emissions inventory from sustainNU.