Measuring Chicago’s Carbon Footprint
Find Us on Social Media
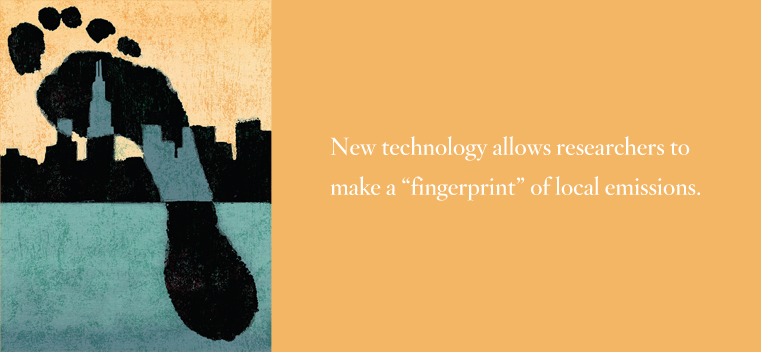
New technology reveals “fingerprint” of local emissions.
It’s easy to point to power plants and industrial smokestacks as major sources of carbon dioxide emissions, but when you drive your car to work or bump up the thermostat on a cold winter morning, those actions contribute to the local emissions mix, too. When measured collectively, the emissions from those individual actions quickly accumulate, especially in Chicago, the nation’s third-largest city. According to the Department of Energy, the residential and transportation sectors contribute approximately 50 percent of all CO2 emissions.
From a Scott Hall rooftop measuring station, Earth and planetary sciences professor Andy Jacobson is tracking the atmospheric concentration of carbon dioxide in the Chicago area. Understanding urban metabolism (the unique matter and energy flows in urban areas) is a critical step toward implementing local sustainability initiatives that have global implications.
The project, funded in part by the the Initiative for Sustainability and Energy at Northwestern (see "Seeking Sustainability," winter 2011), began a few years ago when Jacobson found that the atmospheric CO2 levels for Chicago were higher than the global average as measured at Mauna Loa Observatory in Hawaii, where Charles David Keeling (G54), creator of the Keeling Curve, first plotted changes in carbon dioxide concentrations in the Earth’s atmosphere in 1958.
“That led me on an investigation, well, what is the value for Chicago?” Jacobson says. “It blossomed into this idea of urban metabolism and the development of an urban Keeling Curve. If you want to have a conversation about sustainability, you need data. One of our goals is to provide that data.”
Using a relatively new laser-based technology — wavelength-scanned cavity ring down spectroscopy — the Northwestern measuring station provides 12,000 data points per day, a far cry from when grad students collected a handful of painstaking samples to measure a research-worthy CO2 concentration. “It’s a total game changer,” Jacobson says. “Each day we get these big clouds of data, and ultimately we can do some really interesting statistics on all kinds of different temporal scales.”
In January he launched a yearlong study of Chicago’s urban carbon cycle to understand how the local atmospheric system works as a geochemical entity. Data from the measuring station reveal obvious fluctuations based on daily automobile traffic flows as well as large-scale seasonal signals. For instance, in the summer, the data showed a relatively large natural effect from photosynthesis and plant respiration.
Beyond measuring Chicago’s atmospheric CO2 concentrations, Jacobson can also examine isotopic markers that reveal whether local emissions came from a tailpipe or a natural gas furnace. “It’s like a fingerprint or DNA,” he says.
Fossil fuels bear the signature of a particular carbon isotope — carbon-12. Based on the Northwestern measurements, when local CO2 concentrations rise, the isotopic composition of that CO2 becomes more C-12 enriched, which is indicative of this fossil fuel emission.
This CO2 fingerprinting “is a really powerful tool,” Jacobson says. In his view, it also provides compelling data in the discourse about human contributions to the rise of atmospheric CO2. “People are familiar with the ice core record, where there are relatively small variations in CO2 concentrations over glacial-interglacial time scales, but about the time that the industrial revolution begins, CO2 concentrations spike upward.
“Researchers have also analyzed the carbon isotope composition of that CO2. At the same time that CO2 concentrations increase, the isotopic composition of that CO2 trends toward a fossil fuel fingerprint. For isotope geochemists, that’s pretty much the smoking gun, incontrovertible evidence.”
Jacobson is working on a massive-scale expansion of his Chicago-area CO2 measurement project with more stations and locations, perhaps as part of a partnership with the Chicago Public Schools. With additional stations, Jacobson hopes to provide a high-resolution record of Chicago’s atmospheric CO2 levels.
“One of the immediate questions you could ask is, if we’re implementing changes in how we utilize energy or how we insulate our homes, do we see any effect in the data?” Jacobson asks. “A lot of carbon accounting is forward theoretical, but there are very few measurements on the back end to ensure compliance. I don’t expect that these questions will have easy answers, but our project is a step in the right direction.”


 Facebook
 Twitter
 Email
Email


